 0G 0G
0G 0G
Current Price
$1.11 +25.73%
$0.2601 Daily Range (23.43%)
$0.8499$1.11
$285.43M Daily Volume
3,193 BTC
Vol/MktCap: 123.24%
Market Performance
0.67% Relative BTC Volume
The total volume of 0G is $285.43M over the past 24 hours, compared to $42.59B total Bitcoin volume.
Hourly Moving Average
8 SMA $1.02 +9.34%
13 SMA $0.9953 +11.53%
21 SMA $0.9668 +14.81%
55 SMA $0.8599 +29.09%
144 SMA $0.8270 +34.22%
Price Performance
+7.59% 1 Hour Change
$1.11 from $1.03
+25.07% 7 Day Change
$0.2783 from $0.8317
+25.09% 14 Day Change
$0.2785 from $0.8315
+27.08% 30 Day Change
$0.3006 from $0.8094
All Time High
September 23, 2025
$7.05 -84.71%
-$5.97 vs. now
24H Change
43.58M USD +23.18%
487 BTC
Volume and Supply
Total Supply: 1.00B 0G 
213.20M 0G Available21.32% circulating A lower circulating supply may increase over time, reducing scarcity and potentially causing a drop in price. A higher circulating supply is less susceptible to dilution, offering the potential for a more stable price long-term.
Relative Supply Ratio
50.05 x BTC Supply50:1 supply ratio
RSR reflects potential differences in tokenomics, such as inflation rates, utility, or burn mechanisms, which can impact long-term value and scarcity.
Relative Trade Volume
291.27M 0G  traded over past 24 hours
136.62% of circulating supply
A higher trade volume relative to market cap indicates strong market activity and liquidity, while a lower ratio may suggest reduced interest, lower liquidity, or potential price stagnation.
Conversion Tool
 0G AI Market Analysis
0G is currently priced at 1.088 USD, reflecting a significant 24-hour change of 11.39%. The daily trading range has been relatively stable, with a low of 0.9318 and a high of 1.12, indicating strong volatility that can attract traders looking for short-term gains.
Trading volume stands at 118,948,344, which is robust given the market cap volume ratio of 51.31%. This high volume suggests increased interest in 0G, likely driven by recent price movements, and indicates potential liquidity for traders.
The hourly moving averages indicate a bullish trend, with the 8 SMA showing a gain of 10.53% and the 55 SMA up 9.54%. Meanwhile, the 1-hour RSI is at 76, suggesting that the asset is currently overbought, while the 7-day RSI of 58 shows a more balanced sentiment.
The 7-day price change of approximately 30.76% reflects strong momentum, which can attract further buying interest. However, the 30-day price change indicates a decline of nearly 9.89%, suggesting that the recent surge may be a short-term correction after a longer downtrend.
Despite the current upward trend, the asset is approaching the overbought territory, and caution is advised for new positions. Given the potential for profit-taking in the near term and the overbought signals, the recommendation is to Hold on to 0G for now, assessing market conditions and further price action before making additional commitments.
Updated 36847 minutes ago.
 0G Relative Price at Market Cap of:
 0G TradingView Chart
In The News

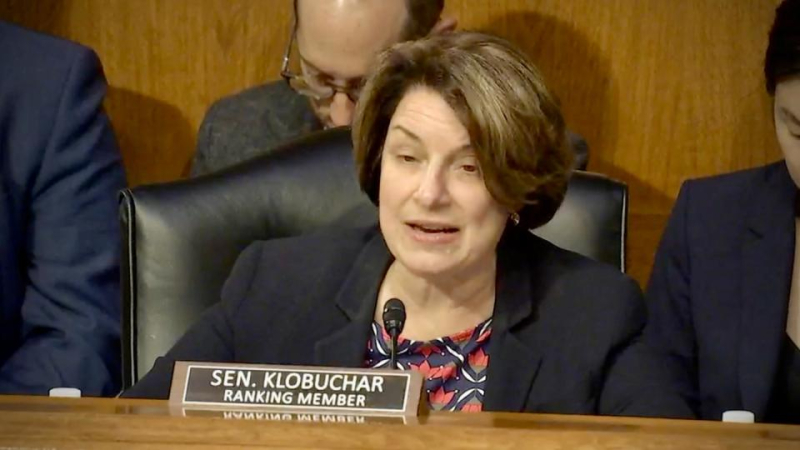
Senate Agriculture's crypto market structure draft peppered with Democrat pitches
The latest draft of the major crypto legislation has begun to be targeted with amendments as the Senate Agriculture Committee approaches its hearing next week.

US dollar slides toward steepest weekly drop in seven months on policy uncertainty
The dollar's decline highlights growing investor unease over US economic policy stability, potentially impacting global financial markets.

Binance plans to bring back tokenized stock trading after 2021 retreat
The exchange shut down its earlier effort under regulatory pressure, but it's now back to exploring offering tokenized equities on its platform.

Digitap ($TAP) vs. $1.89 XRP vs. $1.49 SUI: Why $TAP is the Best Crypto To Buy In 2026
Ripple’s XRP token staged a brief rebound to start the year, with the token looking to test the $2.50 level.