 crvUSD CRVUSD
Current Price
$1.00 +0.01%
$0.0004 Daily Range (0.04%)
$0.9995$0.9999
$7.72M Daily Volume
98 BTC
Vol/MktCap: 2.56%
Market Performance
 -1.10% 0.00001266 BTC
 -1.72% 0.0004 ETH
 +0.01% 1.00 USDT
 -0.68% 0.7143 XRP
 -0.47% 0.0016 BNB
0.04% Relative BTC Volume
The total volume of crvUSD is $7.72M over the past 24 hours, compared to $19.24B total Bitcoin volume.
Hourly Moving Average
8 SMA $0.9997 +0.03%
13 SMA $0.9997 +0.03%
21 SMA $0.9997 +0.03%
55 SMA $0.9998 +0.02%
144 SMA $0.9998 +0.02%
Price Performance
+0.03% 1 Hour Change
$1.00 from $0.9997
+0.03% 7 Day Change
$0.0003 from $0.9997
+0.05% 14 Day Change
$0.0005 from $0.9995
+0.40% 30 Day Change
$0.0040 from $0.9960
All Time High
June 13, 2024
$1.11 -9.62%
-$0.1068 vs. now
24H Change
931.88K USD +0.31%
12 BTC
Volume and Supply
Total Supply: 301.54M CRVUSD
301.54M CRVUSD Available100.00% circulating A lower circulating supply may increase over time, reducing scarcity and potentially causing a drop in price. A higher circulating supply is less susceptible to dilution, offering the potential for a more stable price long-term.
Relative Supply Ratio
15.06 x BTC Supply = 15:1 supply ratio
RSR reflects potential differences in tokenomics, such as inflation rates, utility, or burn mechanisms, which can impact long-term value and scarcity.
Relative Trade Volume
7.72M CRVUSD traded over past 24 hours
2.56% of circulating supply
A higher trade volume relative to market cap indicates strong market activity and liquidity, while a lower ratio may suggest reduced interest, lower liquidity, or potential price stagnation.
Conversion Tool
crvUSD AI Market Analysis
CRVUSD is currently trading at $0.99968, showing a slight 24-hour change of -0.01495%. The daily price range has remained tight, with a high of $1 and a low of $0.999532, indicating low volatility and stability in its price action.
The trading volume over the past 24 hours stands at 9,162,590, which corresponds to a volume-to-market cap ratio of 3.04%. This suggests that trading activity is relatively moderate, reflecting a balanced interest among investors without extreme speculative behavior.
The hourly moving averages are clustered around $0.9997 to $0.9998, with minimal changes, indicating that the short-term trend remains neutral. The 1-hour RSI at 51 and the 7-day RSI at 50 further confirm that the market is neither overbought nor oversold, suggesting equilibrium in buying and selling pressure.
Over the past 30 days, CRVUSD has experienced a price increase of approximately 0.2588, reflecting a positive longer-term trend. However, the recent 7-day price change of only 0.00116 indicates a slowdown in momentum, which could suggest market consolidation at these levels.
With an all-time high of $1.11 reached on June 13, 2024, CRVUSD has potential upside but is currently trading close to its peg of $1. Given the stability in price and the neutral indicators across various time frames, the recommendation is to Hold CRVUSD at this time. This rating is based on the current equilibrium in the market and the lack of significant momentum in either direction, suggesting that investors may want to wait for clearer signals before making further moves.
Updated 154 minutes ago.
crvUSD Relative Price at Market Cap of:


crvUSD TradingView Chart
You May Also Like

Stellar XLM
$0.1605 +0.01%
Rain RAIN
$0.0077 -2.02%

Circle USYC USYC
$1.12 0.00%

Bitget Token BGB
$2.02 +0.47%

Quant QNT
$69.23 +0.61%
EURC EURC
$1.17 +0.00%

Pendle PENDLE
$1.61 +4.82%

Vision VSN
$0.0495 -0.98%
In The News

Drone strike on Chornobyl escalates Russo-Ukrainian conflict tensions
The drone strike's impact on nuclear sites heightens geopolitical instability, complicating ceasefire prospects and international diplomatic efforts.

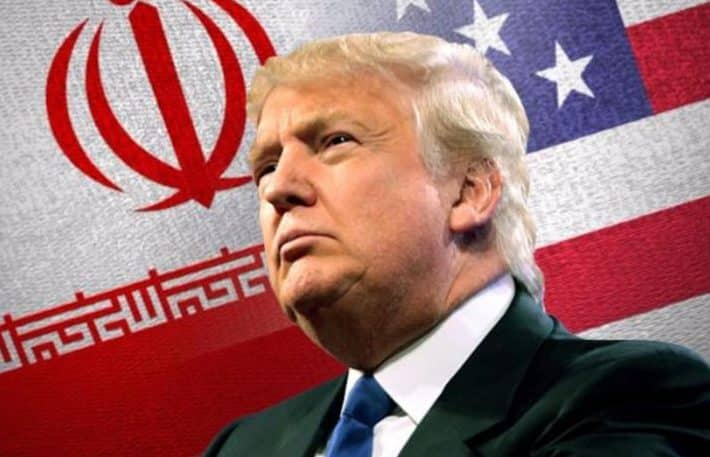
US, Israeli military leaders intensify coordination amid Iran conflict
Increased US-Israeli military coordination may escalate regional tensions, impacting geopolitical stability and influencing global market dynamics.

Kaspa nears a critical level – Can KAS bulls restart the rally now?
KAS is testing a major demand zone as rising whale activity and strong network growth begin to support reversal potential.
US redirects 48 vessels to enforce Hormuz blockade amid ongoing operation
The sustained enforcement of the Hormuz blockade underscores ongoing geopolitical tensions, impacting market expectations and regional stability.