 GTETH GTETH
Current Price
$2,983.03 -0.37%
$30.74 Daily Range (1.03%)
$2,963.47$2,994.21
$88.94K Daily Volume
1 BTC
Vol/MktCap: 0.02%
Market Performance
0.00% Relative BTC Volume
The total volume of GTETH is $88.94K over the past 24 hours, compared to $30.51B total Bitcoin volume.
Hourly Moving Average
8 SMA $2,976.98 +0.20%
13 SMA $2,976.34 +0.22%
21 SMA $2,975.15 +0.26%
55 SMA $2,972.92 +0.34%
144 SMA $2,954.41 +0.97%
Price Performance
-0.08% 1 Hour Change
$2,983.03 from $2,985.34
+1.95% 7 Day Change
$58.05 from $2,924.98
+3.84% 14 Day Change
$114.46 from $2,868.57
+5.57% 30 Day Change
$166.15 from $2,816.88
All Time High
October 7, 2025
$4,751.71 -37.37%
-$1,775.61 vs. now
24H Change
-2.33M USD -0.49%
-27 BTC
Volume and Supply
Total Supply: 159.79K GTETH 
159.79K GTETH Available100.00% circulating A lower circulating supply may increase over time, reducing scarcity and potentially causing a drop in price. A higher circulating supply is less susceptible to dilution, offering the potential for a more stable price long-term.
Relative Supply Ratio
0.01 x BTC Supply0.0:1 supply ratio
RSR reflects potential differences in tokenomics, such as inflation rates, utility, or burn mechanisms, which can impact long-term value and scarcity.
Relative Trade Volume
29.00 GTETH  traded over past 24 hours
0.02% of circulating supply
A higher trade volume relative to market cap indicates strong market activity and liquidity, while a lower ratio may suggest reduced interest, lower liquidity, or potential price stagnation.
Conversion Tool
 GTETH AI Market Analysis
GTETH is currently trading at $2,979.04, reflecting a slight 24-hour decline of 0.333%. The daily price range has been relatively tight, with a high of $3,012.84 and a low of $2,963.47, indicating a volatility of 49.37%, suggesting some indecision in the market.
Volume has been recorded at 91,278, translating to a volume-to-market cap ratio of 0.02%, which is low and may imply limited trading activity. The hourly moving averages are showing slight upward momentum, with the 8 SMA at $2,976.98 and the 55 SMA at $2,972.92, hinting at potential short-term bullish sentiment as they exhibit positive slopes.
The RSI indicators are positioned neutrally, with the 1-hour RSI at 55 and the 7-day RSI at 54, indicating that the asset is neither overbought nor oversold. Price changes over the last week, 14 days, and 30 days show positive movements of 1.82%, 4.25%, and 5.47%, respectively, reflecting a gradual uptrend in GTETH's value.
The all-time high of $4,751.71, reached on October 7, 2025, sets a significant target but also indicates a substantial drawdown from current levels. Given the slight negative movement in the last 24 hours combined with a relatively stable RSI and upward-moving averages, the current market appears to be consolidating rather than initiating a new trend.
In summary, while GTETH has shown some positive price action over the past month, the recent decline and low trading volume suggest caution. The recommendation is to Hold GTETH at this stage, as further confirmation of a bullish trend is necessary before making new investments.
Updated 117 minutes ago.
 GTETH Relative Price at Market Cap of:
 GTETH TradingView Chart
In The News

Tether adds 8,888 Bitcoin to reserves; total holdings top 96,000 BTC
Tether's growing Bitcoin reserves highlight its strategic shift towards crypto-backed stability, potentially influencing market dynamics and trust.

'Massive' liquidity injections to boost BTC price in 2026, crypto exec says
Money printing is a catalyst for higher risk-on asset prices, but the looming 2026 US midterm elections could throw a wrench in markets.

Will XRP’s price hit $8 after XRP ETF inflows climb to $18 Billion?
Whales renewed Q4 sell-off, further capping XRP's recovery.

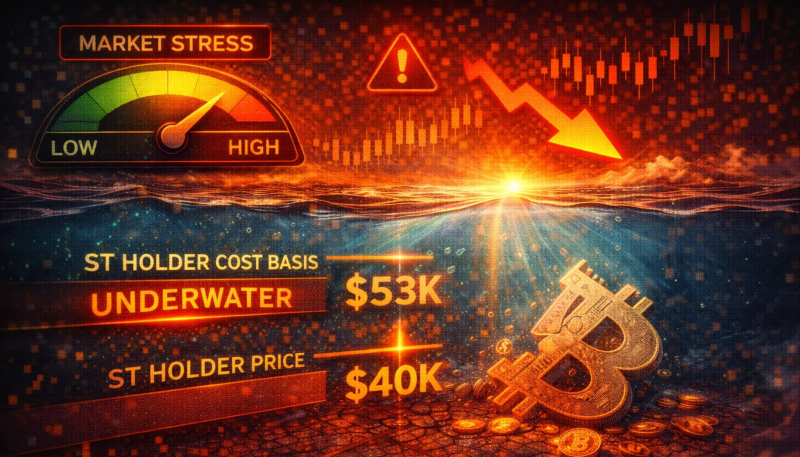
Bitcoin Market Stress Isn’t Over: Short-Term Holders Remain Underwater
Bitcoin has managed to reclaim the $88,000 level, yet it continues to struggle below the key $90,000 threshold, failing to sustain any meaningful breakout since early December.