 KAITO KAITO
Current Price
$1.59 -2.13%
$0.0800 Daily Range (5.03%)
$1.58$1.66
$49.89M Daily Volume
466 BTC
Vol/MktCap: 13.03%
Market Performance
0.26% Relative BTC Volume
The total volume of KAITO is $49.89M over the past 24 hours, compared to $19.40B total Bitcoin volume.
Hourly Moving Average
8 SMA $1.60 -0.70%
13 SMA $1.62 -1.64%
21 SMA $1.62 -1.93%
55 SMA $1.58 +0.40%
144 SMA $1.48 +7.19%
Price Performance
-0.06% 1 Hour Change
$1.59 from $1.59
+11.48% 7 Day Change
$0.1826 from $1.41
+11.78% 14 Day Change
$0.1874 from $1.40
-17.15% 30 Day Change
-$0.2727 from $1.86
All Time High
February 27, 2025
$2.88 -45.00%
-$1.30 vs. now
24H Change
-8.18M USD -2.09%
-76 BTC
Volume and Supply
Total Supply: 1.00B KAITO 
241.39M KAITO AvailableRelative Supply Ratio
47.62 x BTC Supply =
= 


Relative Trade Volume
30.80M KAITO  traded over past 24 hours
Conversion Tool
KAITO AI Market Analysis
The trading volume stands at 54,967,140, with a volume-to-market cap ratio of 14.34%, suggesting a healthy liquidity environment but not enough to spark significant price movements. The short-term moving averages are showing bearish signals, with the 8, 13, and 21 SMA all declining, while the 55 SMA indicates a slight bullish trend.
The 1-hour RSI is at 40, indicating the asset is nearing oversold conditions in the short term, which could prompt a price rebound. In contrast, the 7-day RSI at 55 reflects a neutral to slightly bullish sentiment over the past week, supported by an 11.80% price increase in that timeframe.
However, the longer-term trend is concerning, as the 30-day price change shows a decline of nearly 20%. With the all-time high of $2.88 achieved in February 2025, current prices represent a significant depreciation from that peak, highlighting ongoing bearish sentiment in the market.
Considering the current technical indicators and market dynamics, the recommendation is to Hold KAITO. While there are signs of potential short-term recovery, the lack of strong bullish momentum and the recent decline in price suggest caution for new buyers.
Updated 192 minutes ago.
KAITO Relative Price at Market Cap of:
 KAITO TradingView Chart
You May Also Like

Ethereum ETH
$2,484.70 -0.75%

Pi Network PI
$0.4997 -5.05%

Bittensor TAO
$333.17 -1.82%

Jupiter Perpetuals Liquidity Provider Token JLP
$4.50 +0.08%

Arbitrum Bridged WBTC (Arbitrum One) WBTC
$107,177 -1.21%

Ket KET
$0.3724 -1.89%
EOS EOS
$0.4908 -2.95%

Compounding OpenDollar CUSDO
$1.02 +0.02%
In The News

Circle applied to charter First National Digital Currency Bank to become a federally regulated trust that would manage USDC reserves and expand custody services for institutional c...

Institutional digital asset investment vehicles have enjoyed over $16 billion in inflows over the last eleven weeks, according to crypto asset management firm CoinShares.

A lower court ruling will stand in a case involving a Coinbase user who filed a lawsuit against the IRS after the crypto exchange turned over transaction data.

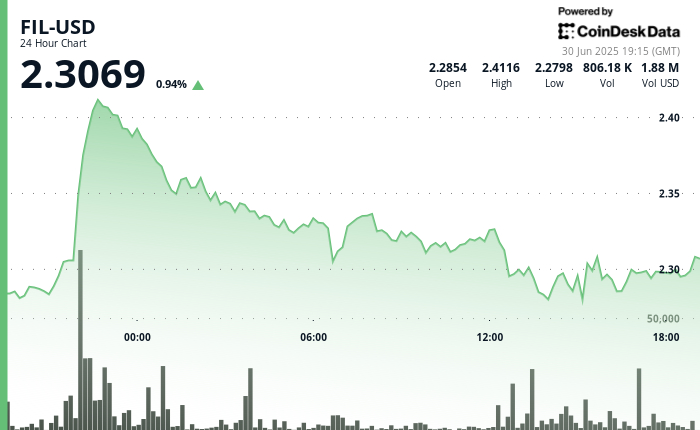
The FIL token gained 6% before encountering high-volume resistance at the $2.41 level.


