 Virtuals Protocol VIRTUAL
Current Price
$0.5982 -3.90%
$0.0511 Daily Range (8.54%)
$0.5827$0.6337
$58.44M Daily Volume
895 BTC
Vol/MktCap: 14.94%
Market Performance
0.13% Relative BTC Volume
The total volume of Virtuals Protocol is $58.44M over the past 24 hours, compared to $46.14B total Bitcoin volume.
Hourly Moving Average
8 SMA $0.6082 -1.64%
13 SMA $0.6059 -1.27%
21 SMA $0.6122 -2.29%
55 SMA $0.6307 -5.15%
144 SMA $0.6346 -5.73%
Price Performance
-3.44% 1 Hour Change
$0.5982 from $0.6195
-9.74% 7 Day Change
-$0.0583 from $0.6565
+5.09% 14 Day Change
$0.0304 from $0.5678
-26.97% 30 Day Change
-$0.1614 from $0.7596
All Time High
January 2, 2025
$5.07 -88.13%
-$4.47 vs. now
24H Change
-17.34M USD -4.24%
-266 BTC
Volume and Supply
Total Supply: 1.00B VIRTUAL 
656.28M VIRTUAL Available65.63% circulating A lower circulating supply may increase over time, reducing scarcity and potentially causing a drop in price. A higher circulating supply is less susceptible to dilution, offering the potential for a more stable price long-term.
Relative Supply Ratio
50.02 x BTC Supply50:1 supply ratio
RSR reflects potential differences in tokenomics, such as inflation rates, utility, or burn mechanisms, which can impact long-term value and scarcity.
Relative Trade Volume
96.08M VIRTUAL  traded over past 24 hours
14.64% of circulating supply
A higher trade volume relative to market cap indicates strong market activity and liquidity, while a lower ratio may suggest reduced interest, lower liquidity, or potential price stagnation.
Conversion Tool
 Virtuals Protocol AI Market Analysis
Virtuals Protocol (VIRTUAL) is currently priced at $0.62043, reflecting a 24-hour decrease of 2.78%. The asset has experienced a daily range from a low of $0.582654 to a high of $0.638194, indicating volatility within a narrow band of approximately 5.54%.
Volume stands at 57,065,828, which represents 14.02% of the market cap, suggesting a reasonable level of trading activity. The moving averages reveal a mixed trend; the shorter-term SMAs (8 and 13 periods) show upward momentum, while the longer-term SMAs (55 and 144 periods) indicate downward pressure.
The 1-hour RSI is at 47, while the 7-day RSI sits slightly higher at 49, suggesting that VIRTUAL is nearing oversold territory without being in it yet. The asset has seen a -5.09% change over the past week, though it is up by 9.10% over the last 14 days, indicating short-term weakness against a backdrop of longer-term recovery.
Over the past 30 days, VIRTUAL has declined by 24.86%, which is a significant pullback compared to its historical all-time high of $5.07 achieved on January 2, 2025. This long-term price trend underscores a bearish sentiment but also highlights potential for a rebound if the asset can stabilize and regain investor confidence.
Given the current technical indicators, including mixed moving averages and a neutral RSI, VIRTUAL appears to be in a consolidation phase. However, the recent downtrend and significant price drop over the last month raise concerns about immediate upward momentum.
Rating: Hold. The mixed signals suggest a cautious approach; while the asset is not in a strong sell position, there is insufficient bullish evidence to warrant a buy at this time. Monitoring for stabilization or positive volume spikes may present future buying opportunities.
Updated 334 minutes ago.
 Virtuals Protocol Relative Price at Market Cap of:
 Virtuals Protocol TradingView Chart
In The News

XRP: Mapping the $45mln supply shock and its impact on ETF demand
How will the token swing next?

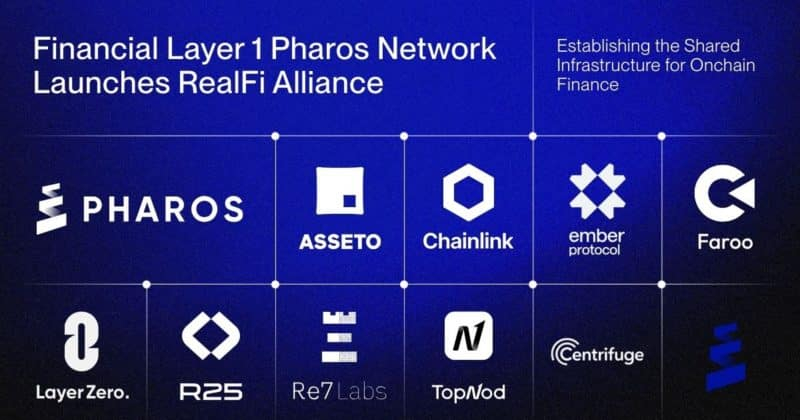
Pharos Network launches RealFi Alliance to unify real-world asset markets
The RealFi Alliance could significantly enhance institutional adoption of tokenized assets by standardizing and scaling the RWA market.

Central Bank of Brazil to Advance Institutional VASP Regulation by 2027
The central bank will focus on designing a regulatory framework for the so-called institutional VASPs, defined as organizations that operate infrastructure and provide crypto…

Decoding KITE’s 14% jump: Is trendline support enough to keep bears at bay?
KITE bounced hard from support, but derivatives traders are still leaning short… will momentum force a squeeze?