 DeAgentAI AIA
Current Price
$7.22 +325.12%
$6.65 Daily Range (92.11%)
$1.61$8.26
$114.21M Daily Volume
1,128 BTC
Vol/MktCap: 15.85%
Market Performance
0.18% Relative BTC Volume
The total volume of DeAgentAI is $114.21M over the past 24 hours, compared to $63.03B total Bitcoin volume.
Hourly Moving Average
8 SMA $3.87 +86.72%
13 SMA $3.08 +134.65%
21 SMA $2.55 +183.46%
55 SMA $2.30 +214.19%
144 SMA $1.65 +336.37%
Price Performance
+52.15% 1 Hour Change
$7.22 from $4.75
+495.53% 7 Day Change
$35.78 from -$28.56
+442.94% 14 Day Change
$31.98 from -$24.76
+169.61% 30 Day Change
$12.25 from -$5.03
All Time High
November 6, 2025
$8.26 -8.34%
-$0.6891 vs. now
24H Change
551.78M USD +326.60%
5,448 BTC
Volume and Supply
Total Supply: 1.00B AIA 
99.50M AIA Available9.95% circulating A lower circulating supply may increase over time, reducing scarcity and potentially causing a drop in price. A higher circulating supply is less susceptible to dilution, offering the potential for a more stable price long-term.
Relative Supply Ratio
50.14 x BTC Supply50:1 supply ratio
RSR reflects potential differences in tokenomics, such as inflation rates, utility, or burn mechanisms, which can impact long-term value and scarcity.
Relative Trade Volume
23.14M AIA  traded over past 24 hours
23.26% of circulating supply
A higher trade volume relative to market cap indicates strong market activity and liquidity, while a lower ratio may suggest reduced interest, lower liquidity, or potential price stagnation.
Conversion Tool
 DeAgentAI AI Market Analysis
DeAgentAI (AIA) is currently trading at $4.46, reflecting a remarkable 143.75% increase over the last 24 hours, demonstrating significant volatility in its price movement. The 24-hour trading range has spanned from a low of $1.61 to a high of $6.93, indicating strong market interest and potential for further price swings.
The trading volume of 128,083,688 suggests high liquidity, as evidenced by a volume-to-market cap ratio of 27.54%. This robust trading activity supports the recent price surge and signals trader confidence, which could lead to sustained upward momentum in the short term.
Short-term moving averages show a bullish trend with the 8 SMA at $1.99 (+124.03%) and the 13 SMA at $1.87 (+138.45%), both indicating substantial gains. The 1-hour RSI at 97 indicates that AIA is in overbought territory, suggesting a potential pullback or consolidation may occur soon.
In the context of longer-term performance, AIA has experienced significant price increases over various time frames, with a 7-day price change of 297.21%, and 14-day and 30-day price changes of 232.73% and 76.63%, respectively. The 7-day RSI of 67 indicates that while the asset is still in bullish territory, it is approaching overbought levels, which could lead to a slowdown in upward price action.
Given the recent surge and current technical indicators, AIA is positioned for potential profit-taking, especially considering the high RSI readings and historical volatility. However, with the all-time high still within reach at $6.93, there may be opportunities for short-term traders to capitalize on further momentum.
In conclusion, the current technical indicators suggest a favorable outlook, yet the high RSI and recent volatility warrant caution. Therefore, a rating of Hold is recommended, as traders should monitor for signs of a potential pullback while remaining alert for any opportunities to enter at lower levels.
Updated 361 minutes ago.
 DeAgentAI Relative Price at Market Cap of:
 DeAgentAI TradingView Chart
In The News

Ethereum (ETH) Price Prediction: Is Ethereum Preparing for a 50–100% Rally as $3,200 Support Signals Bullish Reversal Ahead?
Ethereum (ETH) is back in the spotlight as traders eye a potential rebound, with key support near $3,200 sparking optimism for a surge toward $4,000.

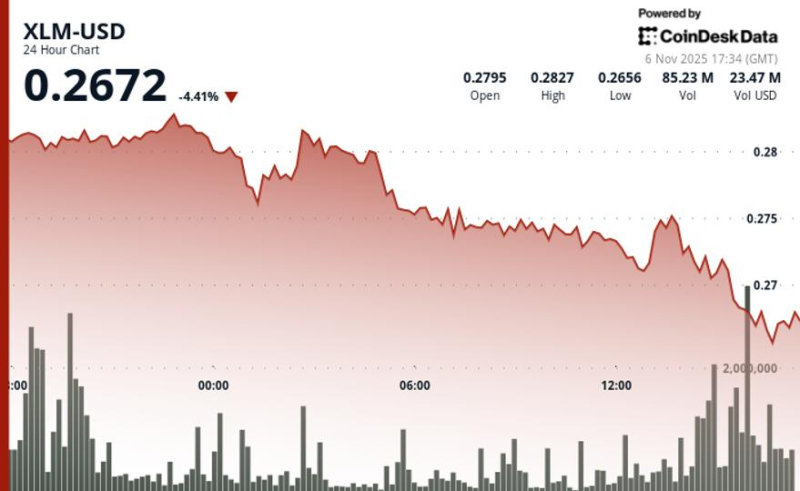
Stellar Faces Renewed Selling Pressure as XLM Reverses From Key Resistance
Stellar (XLM) slid 2.2% amid heavy selling at the $0.2815 resistance level, confirming continued bearish momentum as volume spiked.

Bitcoin: 3 warning signs that BTC might drop below $100K!
One-third of BTC underwater: Investors weigh caution vs.

Bitcoin is getting too expensive to mine profitably: What breaks first – hashrate, UX, or ideology?
With the spotlight this cycle fixed on corporate Bitcoin treasuries, ETF inflows, and shifting global liquidity, Bitcoin’s miners have become the overlooked backbone of the…