 Algorand ALGO
Current Price
$0.0856 -1.64%
$0.0037 Daily Range (4.38%)
$0.0834$0.0871
$25.27M Daily Volume
382 BTC
Vol/MktCap: 3.32%
Market Performance
0.06% Relative BTC Volume
The total volume of Algorand is $25.27M over the past 24 hours, compared to $44.05B total Bitcoin volume.
Hourly Moving Average
8 SMA $0.0852 +0.54%
13 SMA $0.0851 +0.65%
21 SMA $0.0857 -0.07%
55 SMA $0.0879 -2.63%
144 SMA $0.0899 -4.81%
Price Performance
-0.72% 1 Hour Change
$0.0856 from $0.0862
-9.91% 7 Day Change
-$0.0085 from $0.0941
-9.20% 14 Day Change
-$0.0079 from $0.0935
-28.37% 30 Day Change
-$0.0243 from $0.1099
All Time High
June 20, 2019
$3.56 -97.59%
-$3.47 vs. now
24H Change
-12.59M USD -1.63%
-190 BTC
Volume and Supply
Total Supply: 8.88B ALGO 
8.88B ALGO Available100.00% circulating A lower circulating supply may increase over time, reducing scarcity and potentially causing a drop in price. A higher circulating supply is less susceptible to dilution, offering the potential for a more stable price long-term.
Relative Supply Ratio
444.17 x BTC Supply444:1 supply ratio
RSR reflects potential differences in tokenomics, such as inflation rates, utility, or burn mechanisms, which can impact long-term value and scarcity.
Relative Trade Volume
296.44M ALGO  traded over past 24 hours
3.34% of circulating supply
A higher trade volume relative to market cap indicates strong market activity and liquidity, while a lower ratio may suggest reduced interest, lower liquidity, or potential price stagnation.
Conversion Tool
 Algorand AI Market Analysis
Algorand (ALGO) is currently priced at $0.086005, reflecting a 24-hour decrease of 2.12%. The daily trading range has been narrow, with a high of $0.088352 and a low of $0.083374, indicating a consolidating price action within this range.
Volume over the past 24 hours stands at 25,228,020, translating to a volume-to-market cap ratio of 3.30%. This relatively low volume suggests reduced trading interest, which may contribute to price volatility in the near term.
Technical indicators show mixed signals: the 8-period SMA is at $0.0848 with a slight uptick of 1.36%, while longer SMAs indicate bearish trends, particularly the 55 SMA at $0.0885 down 2.78%. The current RSI values, both hourly and over 7 days at 44, indicate that ALGO is nearing oversold territory but has not yet triggered a strong buy signal.
Over the past week, ALGO has seen a price drop of 9.79%, while the 14-day change is a decline of 10.19%. The 30-day price performance has been significantly worse, with a drop of 28.43%, suggesting a bearish trend that has been in place for nearly a month.
The all-time high for ALGO remains at $3.56, achieved in June 2019, highlighting the substantial distance from current pricing levels. The ongoing bearish momentum and recent price action indicate that ALGO is not yet positioned for a recovery, making a short-term rebound unlikely.
Given the current market conditions, including declining price momentum, bearish technical indicators, and overall negative price trends, the recommendation for ALGO is to Hold. This strategy allows for potential upward corrections in the future without exposing capital to immediate losses in a declining market.
Updated 288 minutes ago.
 Algorand Relative Price at Market Cap of:
 Algorand TradingView Chart
In The News

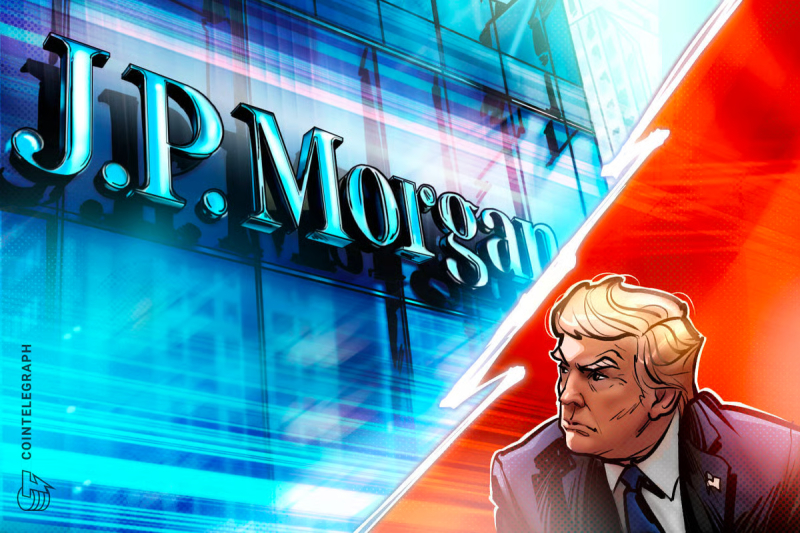
JPMorgan acknowledges closing Trump accounts in new court filing
Court documents indicate that JPMorgan de-banked Trump, with debanking one of the main reasons the Trump family turned to crypto.

Bitmine paper loss hits $8.8B as Ether slump tests cyclical thesis
The mounting unrealized losses of Bitmine shareholders and Ether’s 60% decline are signaling a critical inflection point that may define Ether’s medium-term momentum, analysts…

AI agent sends $441K in tokens after decimal error
The Solana-based trading bot transferred 52.4 million LOBSTAR tokens in a single transaction after an apparent decimal misread.

Why TRON is gearing up for $0.45 despite the market slowdown
TRON shows resilience even as broader crypto participation cools in February 2026.