 Legacy Frax Dollar FRAX
Current Price
$0.9938 -0.02%
$0.0144 Daily Range (1.45%)
$0.9829$0.9974
$8.64M Daily Volume
93 BTC
Vol/MktCap: 3.15%
Market Performance
0.02% Relative BTC Volume
The total volume of Legacy Frax Dollar is $8.64M over the past 24 hours, compared to $37.72B total Bitcoin volume.
Hourly Moving Average
Price Performance
+0.02% 1 Hour Change
$0.9938 from $0.9936
+0.08% 7 Day Change
$0.0008 from $0.9930
+0.13% 14 Day Change
$0.0013 from $0.9925
+0.22% 30 Day Change
$0.0022 from $0.9916
All Time High
February 7, 2021
$1.14 -12.86%
-$0.1466 vs. now
24H Change
-124.21K USD -0.05%
-1 BTC
Volume and Supply
Total Supply: 276.16M FRAX 
276.16M FRAX AvailableRelative Supply Ratio
13.82 x BTC SupplyRelative Trade Volume
8.73M FRAX  traded over past 24 hours
Conversion Tool
 Legacy Frax Dollar AI Market Analysis
Trading volume stands at 8,902,345, which contributes to a volume-to-market cap ratio of 3.24%. This level of activity suggests a moderate interest in FRAX, and the price's stability around the $0.994 level is supported by the hourly moving averages, which are predominantly showing slight upward trends.
The short-term indicators such as the 1-hour RSI at 55 imply that FRAX is neither overbought nor oversold, suggesting a balanced market sentiment. The 7-day RSI is at 51, reinforcing this neutral stance, while the price changes over various time frames—0.236% over the past week and 0.249% over the last 30 days—indicate consistent performance without major fluctuations.
Despite its current price being below the all-time high of $1.14 from February 2021, the recent 30-day price change shows a positive trend. The gradual upward movement in both the short-term and medium-term price metrics is a favorable sign, indicating potential for growth or stability in the near term.
Given the current price positioning, volume metrics, and RSI indicators, a strategic buy may be warranted for investors looking to capitalize on stable assets. Therefore, I assign a Buy rating to FRAX, considering its solid fundamentals and potential for recovery towards its historical high, combined with the overall market's current technical indicators.
Updated 41 minutes ago.
 Legacy Frax Dollar Relative Price at Market Cap of:
 Legacy Frax Dollar TradingView Chart
In The News

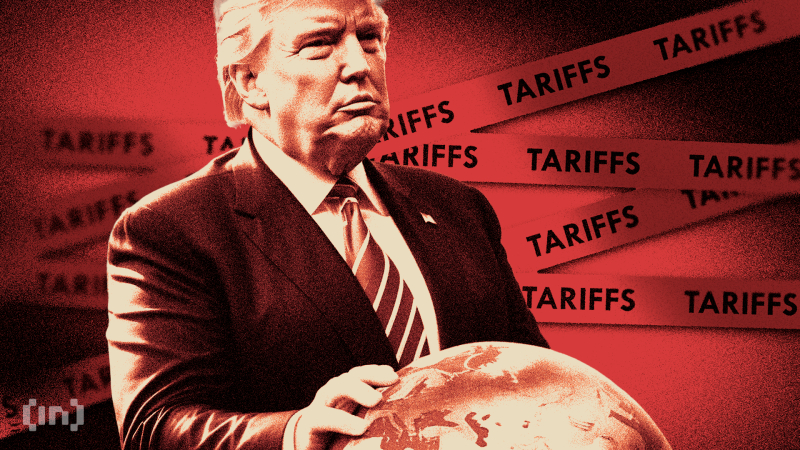
Bitcoin (BTC) and gold moved in opposite directions as tensions over tariffs escalated between US President Donald Trump and the European Union.

Bitcoin is close to the mark of $95,000 and traders are on the lookout. Prices have been fluctuating at high speed upward and downward.

Overregulation of the crypto industry would negatively impact markets and gut decentralized finance (DeFi), according to Michaël van de Poppe.

Only days after BitMine’s (BMNR) annual shareholder meeting in Las Vegas, controversy has erupted, exposing a sharp divide between management and investors.