 Story IP
Current Price
$1.13 -3.05%
$0.1500 Daily Range (13.27%)
$1.12$1.27
$54.60M Daily Volume
791 BTC
Vol/MktCap: 13.83%
Market Performance
0.14% Relative BTC Volume
The total volume of Story is $54.60M over the past 24 hours, compared to $38.97B total Bitcoin volume.
Hourly Moving Average
8 SMA $1.18 -4.23%
13 SMA $1.19 -5.09%
21 SMA $1.18 -4.52%
55 SMA $1.16 -2.52%
144 SMA $1.16 -2.37%
Price Performance
-3.12% 1 Hour Change
$1.13 from $1.17
-14.86% 7 Day Change
-$0.1679 from $1.30
-18.84% 14 Day Change
-$0.2129 from $1.34
-56.83% 30 Day Change
-$0.6421 from $1.77
All Time High
September 21, 2025
$14.78 -92.37%
-$13.65 vs. now
24H Change
-13.77M USD -3.37%
-199 BTC
Volume and Supply
Total Supply: 1.02B IP 
350.43M IP Available34.22% circulating A lower circulating supply may increase over time, reducing scarcity and potentially causing a drop in price. A higher circulating supply is less susceptible to dilution, offering the potential for a more stable price long-term.
Relative Supply Ratio
51.22 x BTC Supply51:1 supply ratio
RSR reflects potential differences in tokenomics, such as inflation rates, utility, or burn mechanisms, which can impact long-term value and scarcity.
Relative Trade Volume
45.69M IP  traded over past 24 hours
13.04% of circulating supply
A higher trade volume relative to market cap indicates strong market activity and liquidity, while a lower ratio may suggest reduced interest, lower liquidity, or potential price stagnation.
Conversion Tool
 Story AI Market Analysis
Story (IP) is currently priced at $1.19, reflecting a 3.95% increase over the past 24 hours. The asset has seen a daily range of $0.13, with a high of $1.27 and a low of $1.14, indicating moderate volatility in the recent trading session.
Trading volume stands at approximately 55.31 million, translating to a 13.24% volume-to-market cap ratio, suggesting significant market activity relative to its overall capitalization. The moving averages indicate a short-term bearish trend with the 8 SMA at $1.20 showing a slight decline, while longer-term averages like the 55 SMA at $1.15 reveal a stronger bullish sentiment.
The 1-hour RSI is at 59, indicating that the asset is approaching overbought conditions, while the 7-day RSI at 49 suggests a more neutral trend over the past week. However, the negative price changes over the 7-day, 14-day, and 30-day periods, at -6.15%, -14.87%, and -54.62% respectively, indicate a longer-term bearish trend.
The all-time high of $14.78, reached on September 21, 2025, shows that the current price is significantly lower, suggesting substantial room for recovery. This prolonged downtrend could be a concern for potential investors, highlighting the importance of risk management.
Considering the mixed signals from technical indicators and the overarching bearish trend, a cautious approach is warranted. Therefore, the recommendation is to Hold, as current conditions do not support a strong bullish case for immediate buying, yet the asset's price is not at a low enough point to justify selling.
Updated 453 minutes ago.
 Story Relative Price at Market Cap of:
 Story TradingView Chart
In The News

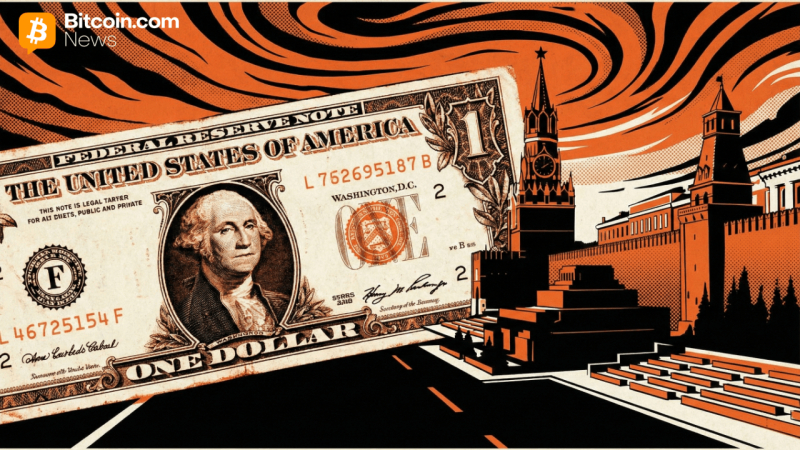
Russia’s Return to the Dollar: A Non-Existing Dilemma
The rumors of discussions on Russia’s return to the dollar system sparked speculation about the strength of the financial alternatives deployed to bypass sanctions.

Latam Insights: Brazil’s 1 Million Bitcoin Strategic Reserve Bill Introduced, Stablecoin Taxation Also in the Works
Welcome to Latam Insights, a compilation of the most relevant crypto news from Latin America over the past week.

Bitcoin Sees Largest Shorts Liquidation Event Since 2024 — What Happened?
As the Bitcoin price tumbled in the past few weeks, several investors are increasingly building short positions against the premier cryptocurrency.

PENGU surges 14% – Can bulls turn exits into a sustained upside?
PENGU tests key resistance as tightening supply reinforces bullish breakout momentum.