 PAX Gold PAXG
Current Price
$4,516.26 +0.08%
$15.51 Daily Range (0.34%)
$4,504.58$4,520.09
$56.18M Daily Volume
620 BTC
Vol/MktCap: 3.25%
Market Performance
0.41% Relative BTC Volume
The total volume of PAX Gold is $56.18M over the past 24 hours, compared to $13.79B total Bitcoin volume.
Hourly Moving Average
8 SMA $4,515.79 +0.01%
13 SMA $4,512.36 +0.09%
21 SMA $4,512.08 +0.09%
55 SMA $4,498.71 +0.39%
144 SMA $4,475.54 +0.91%
Price Performance
+0.03% 1 Hour Change
$4,516.26 from $4,514.83
+3.79% 7 Day Change
$171.22 from $4,345.04
-1.13% 14 Day Change
-$50.88 from $4,567.14
+4.37% 30 Day Change
$197.53 from $4,318.73
All Time High
December 28, 2025
$4,573.52 -1.26%
-$57.65 vs. now
24H Change
1.48M USD +0.09%
16 BTC
Volume and Supply
Total Supply: 382.45K PAXG 
382.45K PAXG Available100.00% circulating A lower circulating supply may increase over time, reducing scarcity and potentially causing a drop in price. A higher circulating supply is less susceptible to dilution, offering the potential for a more stable price long-term.
Relative Supply Ratio
0.02 x BTC Supply0.0:1 supply ratio
RSR reflects potential differences in tokenomics, such as inflation rates, utility, or burn mechanisms, which can impact long-term value and scarcity.
Relative Trade Volume
12.45K PAXG  traded over past 24 hours
3.26% of circulating supply
A higher trade volume relative to market cap indicates strong market activity and liquidity, while a lower ratio may suggest reduced interest, lower liquidity, or potential price stagnation.
Conversion Tool
 PAX Gold AI Market Analysis
PAX Gold (PAXG) is currently trading at $4,513.29, reflecting a slight 24-hour change of 0.14963%. The daily range has been relatively narrow, with a high of $4,520.09 and a low of $4,504.58, indicating a stable price environment despite a 15.51% daily range.
The trading volume stands at $57,362,477, representing 3.32% of the market cap, which suggests a healthy level of trading activity. The hourly moving averages show a mix of stability and slight bullish momentum, with the 55 SMA at $4,498.71 showing a positive shift of 0.32%, while the shorter SMAs remain close to the current price.
The 1-hour RSI of 56 and a 7-day RSI of 55 indicate that the asset is nearing overbought territory but is not yet in it. The price changes over various timeframes show a 3.79% increase over the last week, a minor decline of 1.05% over the last two weeks, and a more robust 5.42% increase over the last month.
PAXG is approaching its all-time high of $4,573.52, reached on December 28, 2025, which may act as a psychological resistance level. However, the recent upward trend and the overall bullish sentiment in the gold-backed cryptocurrency market provide a favorable outlook.
Based on this analysis, I recommend a Buy rating for PAX Gold (PAXG). The asset shows stability in the short term with a positive long-term trend, and the current price remains well-positioned for potential gains as it approaches historical highs.
Updated 340 minutes ago.
 PAX Gold Relative Price at Market Cap of:
 PAX Gold TradingView Chart
In The News

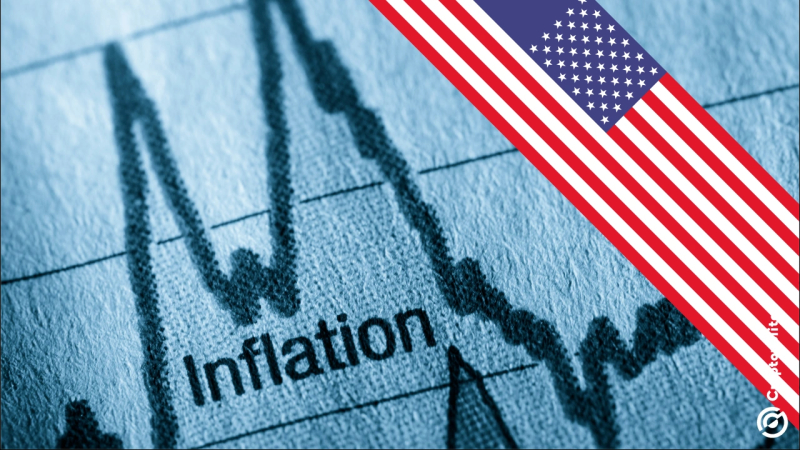
Inflation pressures have eased, with core CPI expected to rise to 2.7%
Inflation pressures have eased, with core CPI expected to rise slightly to 2.7% in December, still near its lowest level since early 2021.

Tennessee sends cease-and-desist letters to Kalshi, Polymarket, Crypto.com
Tennessee regulator warned that failure to comply could trigger steep fines, court injunctions and potential law enforcement referrals for for further investigation.

XRP Breaks Out To $2.27 While Digitap ($TAP) Simplifies Digital Finance: Could $TAP Outperform XRP This Year?
The crypto market continues to deliver surprises as XRP climbs back toward key resistance levels.

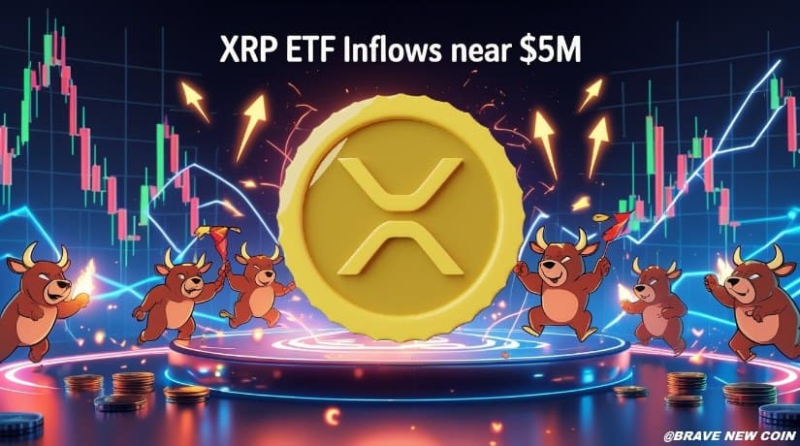
XRP Price Prediction: Oversold Signals Emerge as ETF Inflows Near $5M and Price Tests Key Support
XRP is navigating a pivotal phase as oversold technical signals, renewed ETF inflows, and tightening price ranges converge, placing the cryptocurrency at a critical short-term…