 VeChain VET
Current Price
$0.0123 +3.16%
$0.0006 Daily Range (4.90%)
$0.0119$0.0125
$29.73M Daily Volume
305 BTC
Vol/MktCap: 2.80%
Market Performance
0.04% Relative BTC Volume
The total volume of VeChain is $29.73M over the past 24 hours, compared to $76.52B total Bitcoin volume.
Hourly Moving Average
8 SMA $0.0123 +0.43%
13 SMA $0.0123 +0.52%
21 SMA $0.0122 +1.25%
55 SMA $0.0117 +5.07%
144 SMA $0.0117 +5.05%
Price Performance
+0.61% 1 Hour Change
$0.0123 from $0.0122
+1.19% 7 Day Change
$0.0001 from $0.0122
+17.74% 14 Day Change
$0.0022 from $0.0101
+16.67% 30 Day Change
$0.0021 from $0.0103
All Time High
April 19, 2021
$0.2810 -95.62%
-$0.2687 vs. now
24H Change
31.12M USD +3.02%
320 BTC
Volume and Supply
Total Supply: 85.99B VET 
85.99B VET Available100.00% circulating A lower circulating supply may increase over time, reducing scarcity and potentially causing a drop in price. A higher circulating supply is less susceptible to dilution, offering the potential for a more stable price long-term.
Relative Supply Ratio
4,304.46 x BTC Supply4,304:1 supply ratio
RSR reflects potential differences in tokenomics, such as inflation rates, utility, or burn mechanisms, which can impact long-term value and scarcity.
Relative Trade Volume
2.43B VET  traded over past 24 hours
2.83% of circulating supply
A higher trade volume relative to market cap indicates strong market activity and liquidity, while a lower ratio may suggest reduced interest, lower liquidity, or potential price stagnation.
Conversion Tool
 VeChain AI Market Analysis
VeChain (VET) is currently priced at $0.01229259, reflecting a 5.5781% increase over the last 24 hours. The daily trading range has been relatively stable, with a high of $0.0123827 and a low of $0.01159382, indicating a volatility level of 0.00078888 or 6.43% within the session.
The trading volume stands at approximately 31.39 million, representing a 2.97% ratio of its market cap. Analyzing the hourly moving averages, the 8 SMA at $0.0122 shows a positive trend, while the longer-term 55 SMA at $0.0116 indicates a stronger bullish momentum with a 5.57% increase.
The 1-hour RSI is at 62, suggesting that VET is approaching overbought territory, while the 7-day RSI at 53 indicates neutral momentum. In contrast, the asset has experienced a slight decline of 2.18% over the past week, but a more substantial recovery of 14.04% over the last 14 days reflects a potential upward trajectory.
Given VeChain's current pricing and technical indicators, the asset is showing bullish characteristics in the short term, supported by positive movement in shorter SMAs. However, caution is warranted due to the neutral RSI levels and the recent weekly decline, which may indicate potential resistance levels ahead.
Overall, the market sentiment appears cautiously optimistic, but with a close eye on short-term volatility and resistance levels. Therefore, I assign a Buy rating for VeChain (VET) due to its positive daily momentum and longer-term recovery signs, while advising traders to monitor for any immediate pullbacks or shifts in sentiment.
Updated 365 minutes ago.
 VeChain Relative Price at Market Cap of:
 VeChain TradingView Chart
In The News

Visa taps BVNK to power stablecoin payouts on Visa Direct
Visa has chosen BVNK to power Visa Direct pilots using stablecoins, enabling pre-funded cross-border payouts to wallets in select markets.

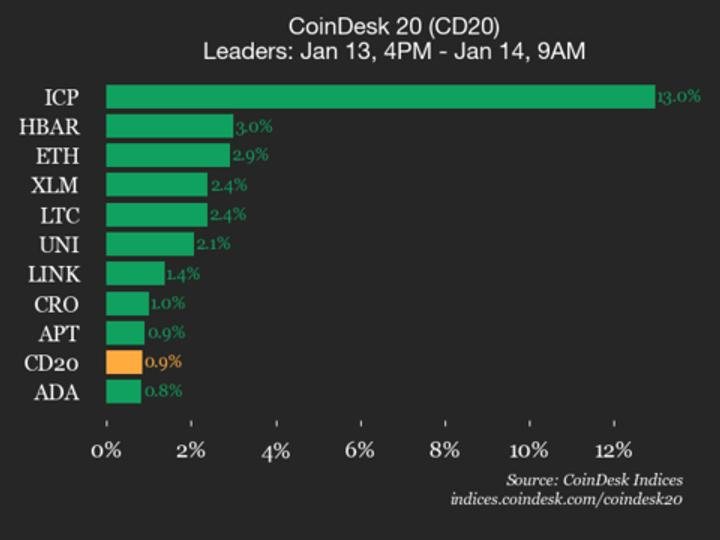
CoinDesk 20 Performance Update: Internet Computer (ICP) Surges 13% as Index Rises
Hedera (HBAR) was also among the top performers, up 3% from Tuesday.

What Crypto Whales Are Buying as The Market Pumps
The crypto market pump gained momentum after the US inflation data came in with a steady number.

Indian authorities seize $1.2 million in land and crypto fraud case
This case highlights the growing need for regulatory oversight in crypto and real estate sectors to prevent financial fraud and protect investors.