 SwissBorg BORG
Current Price
$0.1916 +0.47%
$0.0084 Daily Range (4.37%)
$0.1868$0.1951
$315.42K Daily Volume
5 BTC
Vol/MktCap: 0.17%
Market Performance
0.00% Relative BTC Volume
The total volume of SwissBorg is $315.42K over the past 24 hours, compared to $35.83B total Bitcoin volume.
Hourly Moving Average
8 SMA $0.1910 +0.33%
13 SMA $0.1910 +0.31%
21 SMA $0.1916 +0.02%
55 SMA $0.1931 -0.79%
144 SMA $0.1966 -2.56%
Price Performance
+1.14% 1 Hour Change
$0.1916 from $0.1894
-0.09% 7 Day Change
-$0.0002 from $0.1918
-6.27% 14 Day Change
-$0.0120 from $0.2036
-21.24% 30 Day Change
-$0.0407 from $0.2323
All Time High
May 4, 2021
$1.64 -88.33%
-$1.45 vs. now
24H Change
-294.42K USD -0.16%
-4 BTC
Volume and Supply
Total Supply: 981.85M BORG 
981.85M BORG Available100.00% circulating A lower circulating supply may increase over time, reducing scarcity and potentially causing a drop in price. A higher circulating supply is less susceptible to dilution, offering the potential for a more stable price long-term.
Relative Supply Ratio
49.11 x BTC Supply49:1 supply ratio
RSR reflects potential differences in tokenomics, such as inflation rates, utility, or burn mechanisms, which can impact long-term value and scarcity.
Relative Trade Volume
1.65M BORG  traded over past 24 hours
0.17% of circulating supply
A higher trade volume relative to market cap indicates strong market activity and liquidity, while a lower ratio may suggest reduced interest, lower liquidity, or potential price stagnation.
Conversion Tool
 SwissBorg AI Market Analysis
SwissBorg (BORG) is currently trading at $0.190867, reflecting a slight increase of 0.56542% over the past 24 hours. The price has oscillated within a daily range of $0.188053 to $0.195141, indicating a relatively tight trading band.
Trading volume stands at 315,352, which represents 0.17% of the market cap, suggesting limited investor activity and potentially lower liquidity. The moving averages indicate a bearish short-term trend, with the 8 SMA at $0.1913 and the 55 SMA showing a decline of 1.52% at $0.1938.
The 1-hour RSI is neutral at 49, indicating a balanced market with no immediate overbought or oversold conditions. However, the 7-day RSI at 50 and the 14-day price change of -6.42% signal a lack of upward momentum over the medium term.
The 30-day price change of -19.81% further highlights a significant decline from the recent peak performance, suggesting bearish sentiment in the longer term. The all-time high of $1.64 reached on May 4, 2021, remains a stark contrast to the current valuation, indicating substantial room for recovery.
Given the bearish technical indicators and the lack of upward momentum reflected in the RSI readings, the market sentiment appears cautious. The limited trading volume and negative price changes over the past 30 days also suggest that investors may be hesitant to initiate new positions at this level.
Based on the current analysis, I recommend a Hold rating for SwissBorg (BORG). While the price shows minor stability in the short term, the overall downtrend and bearish signals suggest a wait-and-see approach before making any buy decisions.
Updated 336 minutes ago.
 SwissBorg Relative Price at Market Cap of:
 SwissBorg TradingView Chart
In The News

XRP Smart Money Are Bullish Once Again, Will the Price Echo January’s 30% Rally?
XRP price gained nearly 7% over the past seven days.

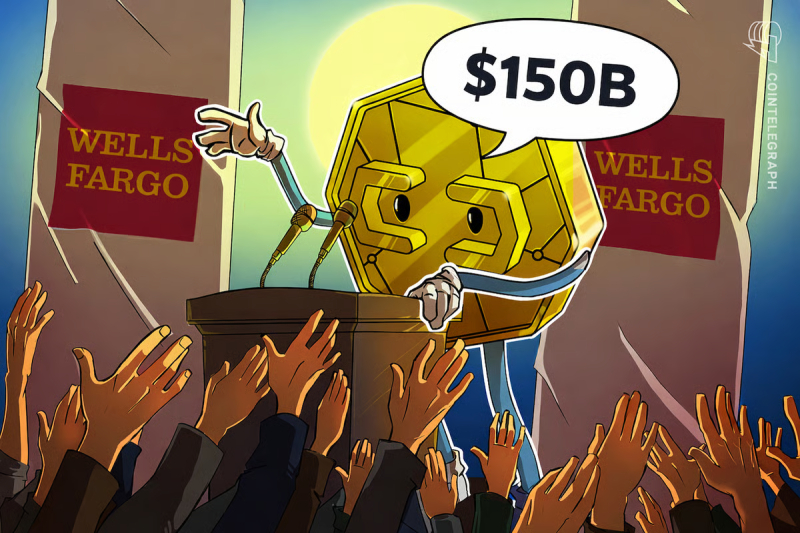
Wells Fargo sees ‘YOLO’ trade driving $150B into Bitcoin and risk assets
A Wells Fargo strategist said bigger US tax refunds may revive retail risk-taking by late March, potentially sending fresh cash into Bitcoin and momentum stocks.

This Korean XRP Exchange Data Has The Community Losing It
Crypto market researcher Dom (@traderview2) says he’s identified what looks like a persistent, algorithmic XRP seller on South Korea’s Upbit: one that, by his estimates, has…

Jupiter DAO votes to cut Jupuary airdrops as JUP stalls near its all-time lows
Jupuary is facing a vote on canceling the 700M JUP airdrop.